Ruby, ChartKick and chart.js versus Google Charts and the Y Axis Auto Sizing

Like a lot of people in the Open Source world, I rarely know actual people in the Open Source world – but I do know github usernames. And one of those names that I truly respect is ankane. I've rarely found a bit of code he wrote that I don't like or use. And while I'm not a big open source creator, I'd like to think that I give back by writing documentation like this blog post.
Today I'm talking about the ChartKick library by ankane. ChartKick is an easy way to build JavaScript charts with a single line of Ruby. I've used ChartKick on and off for years but how it works has always been a bit of a mystery. Hopefully this blog post de-mystifies it a bit.
ChartKick Can Use Different Graphing Engines
I have always used ChartKick in the past just with the default Google Charts engine. Much to my surprise, ChartKick can use chart.js underneath. This is surprising to me and utterly awesome. Here's where I learned this.
Using ChartKick with chart.js
In application.js, you need both of these:
//= require Chart.bundle
//= require chartkick
Note 1: This assumes that you aren't using yarn / webpacker.
Note 2: If you change application.js, you need to restart your development server.
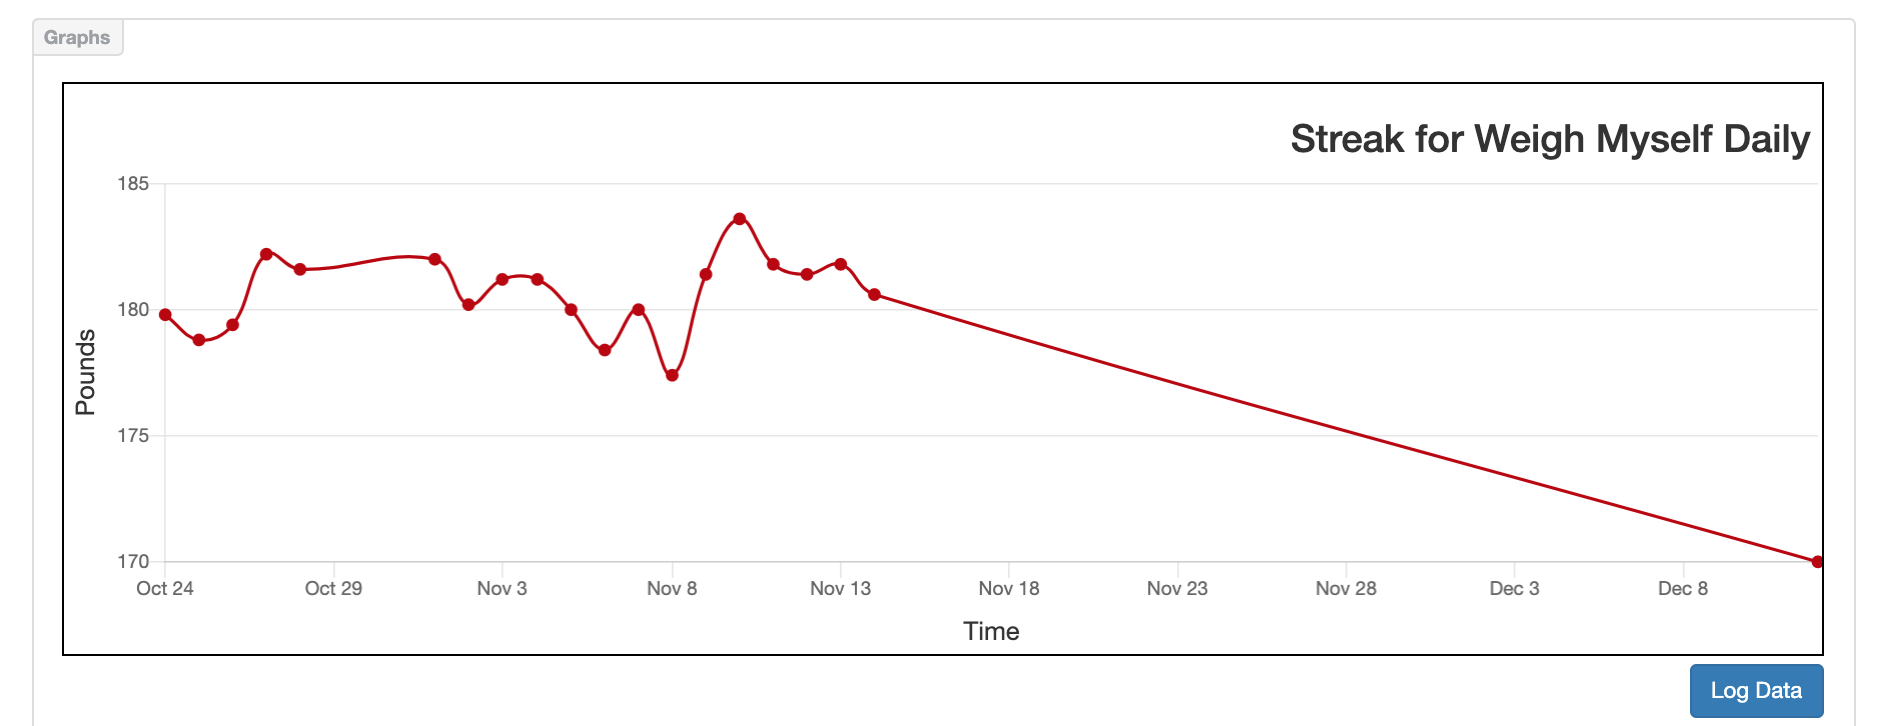
Here's a picture of a graph using chart.js:
Using ChartKick with Google Charts
If you are using ChartKick with Google Charts then you need to remove the line below from application.js:
//= require Chart.bundle
and then you need to add, into your layout or your html template:
<%= javascript_include_tag "https://www.gstatic.com/charts/loader.js" %>
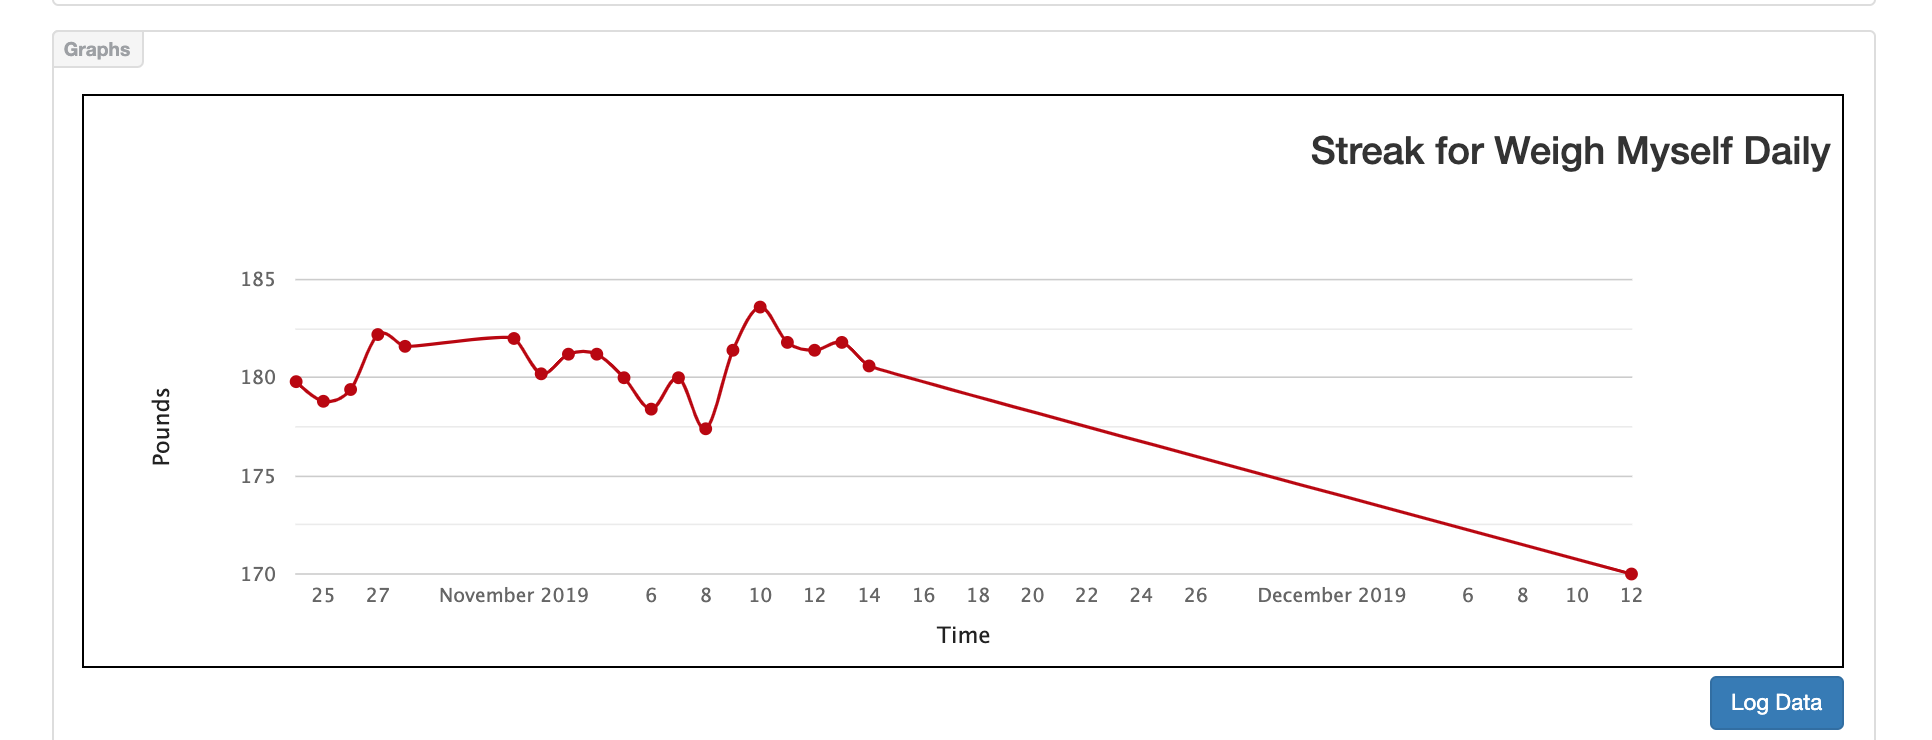
Here's a picture of a graph using Google Charts:
Y Axis Auto Sizing / Setting Axis Minimums Dynamically
The Y axis on my graphs, for years, has always been zero. I had a friend complain about this to me and a documentation grovel (ok I read it more closely than I ever had before) revealed this:
min defaults to 0 for charts with non-negative values. Use nil to let the charting library decide.
Adding a Bit of Color to Your Graph
I haven't used this in quite a while, so here's a reminder on how to use colors:
<%= line_chart data, colors: ["#b00", "#666"] %>
Conclusion
Thank you ankane!
Posted In: #rails #ruby #chartkick #chartjs #google_charts #yaxis